Posts

Showing posts from 2017

Final Map

Image

Final Project Results

Image
The Grey Wolf range extends through most of North America. In the United States, there are three main areas where there are these wolves. Area one includes Washington, Idaho, Montana, and Wyoming. Area two includes Minnesota, Missouri, and Wisconsin. The third area includes Arizona and New Mexico.  Grey Wolf Range Grey Wolf Range in the USA Because Grey Wolves are very adaptable animals, they can be found in a variety of habitats. Although they are generalist s,  they prefer to live in boreal forests, high altitude grasslands, temperate forests, and temperate grasslands. These areas tend to have much larger mammals, which is an important food resource for wolves. Preferred Grey Wolf Habitat Humans have had a history of fearing these animals, and have hunted them almost to extinction. Although there are conservation actions being taken in the three main areas I listed above, their populations have a long road to recovery. The goal of my research was

Research Update

Image
I have narrowed down my options to place the wolf population. I found the hospitals and schools in each county. Then I found which counties have only one school, to minimize negative human-wildlife interactions. While limiting the options, I noticed that many of the counties that I could place the wolf population are very far apart. I want to try to find counties that are close together that have limited people, so that there is not a negative reaction to the introduced wolf population. In North and South Dakota, the counties that I could place the wolves are very far apart, so I have decided to cut them from the list. Oklahoma is also off the list because the only county that was found in that state had too many schools in that area. My new criteria will include that at least two counties must be next to each other, in order for the wolf population to expand without negative human interactions.  After narrowing it down to potential counties, when I added roads, I noticed t

Research Update

I am starting to eliminate states. I decided to not place the wolf population in CA because the single county they would have available is relativity small, and because there are not surrounding areas they could gather resources, they would have many interactions with people. These interactions could pose a threat to people. I also decided not to place a new population in ID, MT, MN, WY, OR or WI. These states already have a current wolf population, and the public may not like additional wolves in the area. Plus, too many predator species contained to one area would drastically effect hunting, which would also affect that stakeholder group. For now, although there were wolves reintroduced to NM, I will keep the counties that I could place the population because it is far away. The states I will look at more closely will be ND, SD, NB, CO, KS, OK, NM, and TX.

Research Update

Image
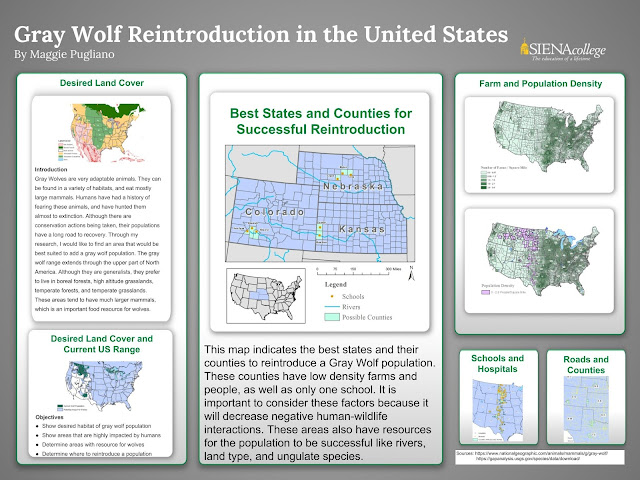
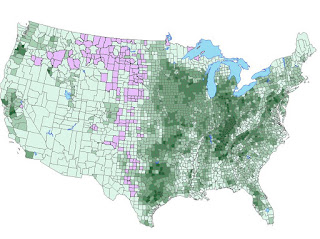
I have made a lot of progress on my maps. I have found the farm and population density for each county. By those numbers, I have chosen states that seem good to place a gray wolf population. This map shows farm density in each county, and the counties with less than 2.9 people per square mile. I picked these categories because I would want the wolf population to be as successful as possible. Many farm owners have negative feelings towards wolves because they prey on their farm animals. I would want to place the population in an area with little to no farms to prevent any issues. The lighter green areas are areas with less farms per square mile, and the darker green have more farms per square mile. The purple areas are counties with less than 2.9 people per square mile, as well as a low farm density. So far, the purple areas are counties I would consider placing the wolf population. These counties can be found in CA, CO, ID, KS, MI, MN, MT, NB, NM, ND, OK, OR, SD, TX, and WY. T

Research Update

Image
It has been very difficult to find accurate data on Coyote's in Arizona. Through researching their populations, I stumbled upon gray wolf populations and how they were reintroduced to areas in Arizona and New Mexico (Subspecies: Mexican Gray Wolf). As I looked at the wolf population more closely, I decided to change my topic to find another area to reintroduce this species in the United States.  Best Place To Reintroduce Gray Wolf Population Introduction Gray Wolves are very adaptable animals. They can be found in a variety of habitats, and eat mostly large mammals. Humans have had a history of fearing these animals, and have hunted them almost to extinction. Although there are conservation actions being taken, their populations have a long road to recovery. Through my research, I would like to find an area that would be best suited to add a gray wolf population.  Objectives Show desired habitat of gray wolf population  Show areas that are highly impacted by humans (cit

Coyote Populations

Coyote Populations in Arizona Introduction Coyotes have a very large population distribution. The coyote population range exists in  Arizona. By viewing where their populations are the greatest, I will determine if their populations are affected or not affected by humans.  Objectives Create an active map Show coyote distribution Show Arizona population Show protected areas for wildlife Determine if there is anything that is altering their population Methodology I will obtain data on coyote populations, protected areas, and people distribution in Arizona.  After I gather those numbers, I will create a map using ArcGIS to show the different layers of information. Deliverables This project will help AZ residents learn about coyote distribution across their state. In this project, I hope to bring awareness about this species. Data Sources https://gapanalysis.usgs.gov/species/data/download/ Work Plan Conduct Research 10/12-11/25 Finalize Project 12/8 Final Project

New Research Project

After going through the honey bee research, I have found that there are many gaps in my data. That being said, I have decided to change my research topic. I will begin looking at coyote populations and National Parks and other conservation areas, and how these areas are effected by populations. Over the next week, I will create a new outline of due dates to catch up for my final project.

Research Update:

Over the past week, I have collected data about the loss of honey bees around the US. I have found so far that Varroa mites and Colony Collapse Disorder (CCD) are the main reasons that cause honey bee colony loss. Next week, I will continue reading through my sources and create a spreadsheet containing the amount of honey bee losses and pesticide use. I will also do more research on Varroa mites, and add them in some way to the spreadsheet, since they have a significant impact on honey bees.  

GIS Proposal

Pecticide Use and Honeybee Loss Introduction Honey bees are essential in how we consume food. They allow us to grow diverse, healthy crops by pollinating each plant. Without honey bees, there would be a drastic decline in the different types of food available.Today, many farms use pesticides to protect crops from nuisance bugs. These pesticides have a detrimental effect on honey bee populations. I will be researching honeybee populations and the amount of pesticide use in the United States. I will study how much the honeybee population is declining, and see if there is a relationship between their decline and the amounts of pesticides used in each state. Objectives Create an active map Show relationship (if any) between bee populations and pesticide use Determine what states have the most bee loss Determine what states have the highest pesticide use Methodology I will obtain data on honey bee populations in the United States. I will also obtain data on pesticide use in